Capture rare failures
Build trigger conditions from variables, events and timing rules. Preserve activity before and after the critical moment.
 Traxcope 1.0 is now available
Real-time embedded observability
See what your firmware is doing while it runs. Trace software execution, correlate RTOS activity and analyze signals in one synchronized workspace.
The visibility gap
The bug can disappear the moment you try to observe it.
Real-time behavior, communication and control loops no longer run as they did when the fault occurred.
Added output consumes bandwidth and execution time, potentially masking intermittent faults.
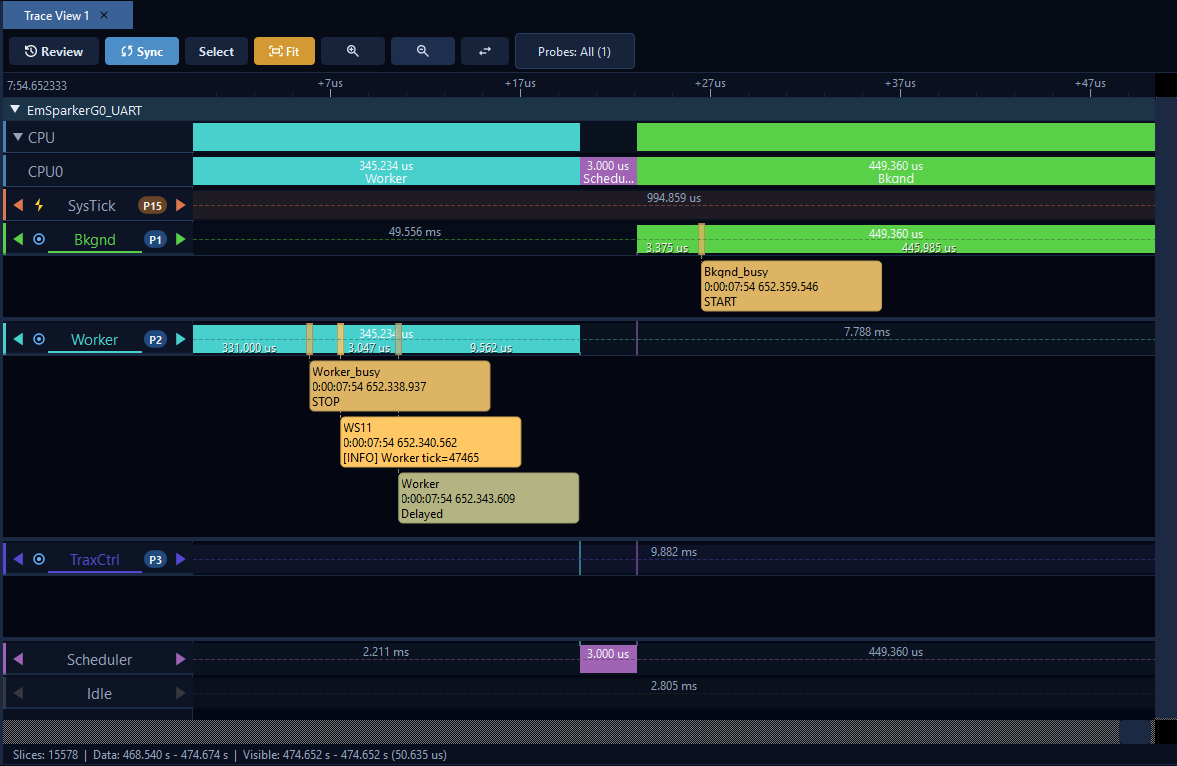
Traxcope brings tasks, interrupts, events, variables and signals onto one synchronized timeline.
One engineering workflow
Capture what happened, preserve the context around it and inspect software and signal behavior together.
Build trigger conditions from variables, events and timing rules. Preserve activity before and after the critical moment.
Synchronize multiple probes, measure cross-device latency and expose timing races on a shared timeline.
Explore streamed signals with scope, FFT, waterfall and 3D spectrum views inside the same workflow.
Inspect RTOS tasks, ISRs, markers, logs, state transitions and live variables without freezing firmware.
See Traxcope in action
The product interface is the proof: precise engineering data, synchronized and ready to investigate.
Trigger Studio
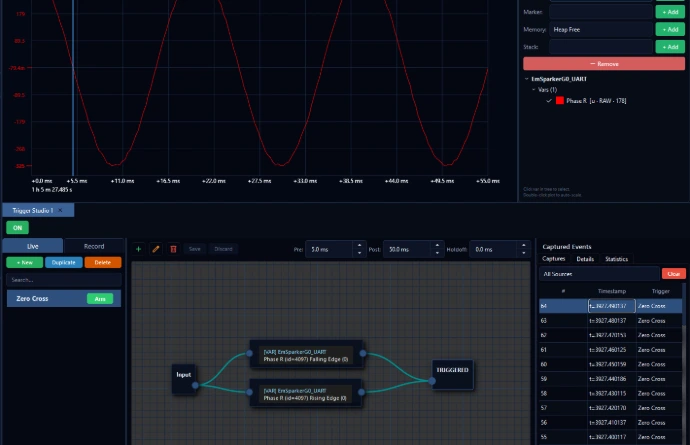
Define visual trigger conditions and preserve pre-trigger and post-trigger activity instead of searching through long recordings.
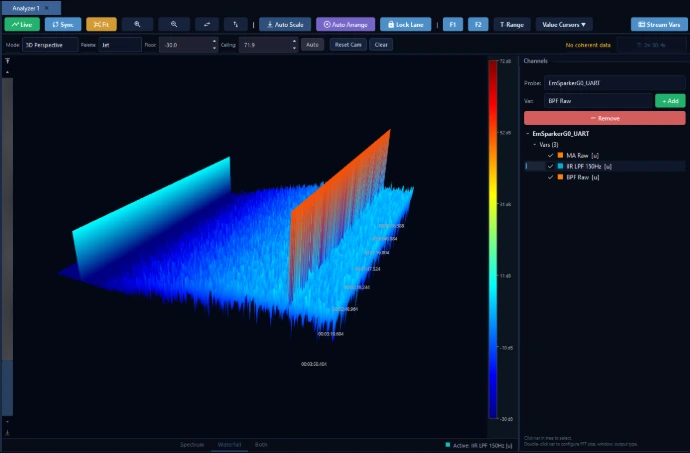
Inspect time-domain and frequency-domain behavior with FFT, waterfall, 3D spectrum and engineering measurements.
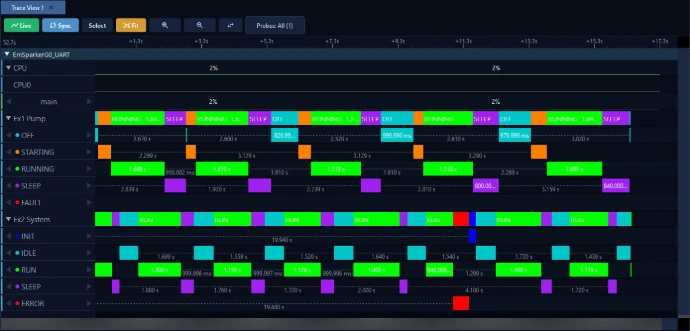
Follow state transitions, task activity, interrupts and events on the same synchronized session.
Product walkthrough
Watch Traxcope in use and get a practical view of the workflow, interface and analysis tools.
How it works
Traxcope adds observability to your current embedded workflow without tying you to a single MCU vendor.
Add the lightweight TraxProbe library and select the variables, events, tasks and signals you need to observe.
Stream diagnostic data through SEGGER RTT, UART or TCP/IP. Inspect it live or record complete sessions.
Correlate trace, logs, RTOS activity and signals. Apply measurements and triggers to uncover the root cause.
Use the ready-to-run tutorial project and guided video to shorten setup time.
From experience to product
In an earlier project, Traxcope developer Burak Emre Polat spent roughly two months investigating a demanding 33 W / 300 ms regulatory condition. Reproducing the event, building a separate interface and moving the data between disconnected tools made the investigation slow and difficult to verify.
That experience helped shape Traxcope: one environment where engineers can capture the moment, keep its timing context and analyze the data without assembling a new diagnostic workflow for every difficult fault.

Founder of Embedya with more than 15 years of experience across defence, industrial and R&D embedded systems.
Built for demanding embedded work
Find timing faults, scheduling problems and unexpected interactions in complex real-time systems.
Validate embedded behavior earlier and reduce repeated debugging and verification cycles.
Offline activation, floating team licences and air-gapped deployment are available on request.
What’s next for Traxcope
Upcoming development focuses on assisted analysis, broader RTOS coverage and support for more embedded targets.
Planned AI-assisted analysis will interpret logs and long recordings, summarize system behavior, surface anomalies and help point engineers toward likely root causes.
Extend task, ISR and kernel-event visibility to Zephyr-based embedded applications.
Support additional microcontroller families, processor architectures and development environments.
Roadmap items are planned work and are not included in Traxcope 1.0. Scope and timing may change as development progresses.
Transparent annual pricing
Paid editions currently include a 30% launch discount for a limited time. One installer supports every edition, and your installation continues in Community mode after a trial or paid licence expires.
A permanent, keyless edition for evaluation, individual engineering and learning.
For everyday embedded tracing, recording and real-time analysis on up to two machines.
For advanced analysis and demanding engineering workflows, with team and offline options available.
The displayed Standard and Professional prices include the limited-time 30% launch discount. Paid prices are per seat, per year. For enterprise, floating or air-gapped deployment, request a tailored licence setup.
Latest stable release
The same installer starts a 14-day Professional trial for a new installation, then continues as the free Community Edition.
No credit card. No account. No forced expiry.
View all releases on GitHubEverything you need to begin
Use the technical guides, ready-to-run projects and short video tutorials to move from installation to real traces quickly.
No. Traxcope is designed to observe software behavior while the firmware continues to run, helping preserve the timing and context you are investigating.
Traxcope currently targets ARM-based microcontrollers and supports bare-metal and FreeRTOS-based applications. The desktop application is available for Windows and Linux. Broader target and RTOS support is on the roadmap.
Yes. Community is permanent, allows commercial use and requires no account or licence key. It includes core views with one connected probe and three minutes of live streaming per hour.
Traxcope continues in Community mode. You can keep using the free features and request a Standard or Professional licence when you need unlimited streaming, recording or advanced workflows.
Yes. Solo Offline, Floating Team and Enterprise or Air-Gapped licence options are available on request.
Start with your own firmware
Download Traxcope, make your first connection and explore every Professional feature for 14 days.
Traxcope 1.0 is now available
Real-time embedded observability
See what your firmware is doing while it runs. Trace software execution, correlate RTOS activity and analyze signals in one synchronized workspace.
The visibility gap
The bug can disappear the moment you try to observe it.
Real-time behavior, communication and control loops no longer run as they did when the fault occurred.
Added output consumes bandwidth and execution time, potentially masking intermittent faults.
Traxcope brings tasks, interrupts, events, variables and signals onto one synchronized timeline.
One engineering workflow
Capture what happened, preserve the context around it and inspect software and signal behavior together.
Build trigger conditions from variables, events and timing rules. Preserve activity before and after the critical moment.
Synchronize multiple probes, measure cross-device latency and expose timing races on a shared timeline.
Explore streamed signals with scope, FFT, waterfall and 3D spectrum views inside the same workflow.
Inspect RTOS tasks, ISRs, markers, logs, state transitions and live variables without freezing firmware.
See Traxcope in action
The product interface is the proof: precise engineering data, synchronized and ready to investigate.
Trigger Studio
Define visual trigger conditions and preserve pre-trigger and post-trigger activity instead of searching through long recordings.
Inspect time-domain and frequency-domain behavior with FFT, waterfall, 3D spectrum and engineering measurements.
Follow state transitions, task activity, interrupts and events on the same synchronized session.
Product walkthrough
Watch Traxcope in use and get a practical view of the workflow, interface and analysis tools.
How it works
Traxcope adds observability to your current embedded workflow without tying you to a single MCU vendor.
Add the lightweight TraxProbe library and select the variables, events, tasks and signals you need to observe.
Stream diagnostic data through SEGGER RTT, UART or TCP/IP. Inspect it live or record complete sessions.
Correlate trace, logs, RTOS activity and signals. Apply measurements and triggers to uncover the root cause.
Use the ready-to-run tutorial project and guided video to shorten setup time.
From experience to product
In an earlier project, Traxcope developer Burak Emre Polat spent roughly two months investigating a demanding 33 W / 300 ms regulatory condition. Reproducing the event, building a separate interface and moving the data between disconnected tools made the investigation slow and difficult to verify.
That experience helped shape Traxcope: one environment where engineers can capture the moment, keep its timing context and analyze the data without assembling a new diagnostic workflow for every difficult fault.
Founder of Embedya with more than 15 years of experience across defence, industrial and R&D embedded systems.
Built for demanding embedded work
Find timing faults, scheduling problems and unexpected interactions in complex real-time systems.
Validate embedded behavior earlier and reduce repeated debugging and verification cycles.
Offline activation, floating team licences and air-gapped deployment are available on request.
What’s next for Traxcope
Upcoming development focuses on assisted analysis, broader RTOS coverage and support for more embedded targets.
Planned AI-assisted analysis will interpret logs and long recordings, summarize system behavior, surface anomalies and help point engineers toward likely root causes.
Extend task, ISR and kernel-event visibility to Zephyr-based embedded applications.
Support additional microcontroller families, processor architectures and development environments.
Roadmap items are planned work and are not included in Traxcope 1.0. Scope and timing may change as development progresses.
Transparent annual pricing
Paid editions currently include a 30% launch discount for a limited time. One installer supports every edition, and your installation continues in Community mode after a trial or paid licence expires.
A permanent, keyless edition for evaluation, individual engineering and learning.
For everyday embedded tracing, recording and real-time analysis on up to two machines.
For advanced analysis and demanding engineering workflows, with team and offline options available.
The displayed Standard and Professional prices include the limited-time 30% launch discount. Paid prices are per seat, per year. For enterprise, floating or air-gapped deployment, request a tailored licence setup.
Latest stable release
The same installer starts a 14-day Professional trial for a new installation, then continues as the free Community Edition.
No credit card. No account. No forced expiry.
View all releases on GitHubEverything you need to begin
Use the technical guides, ready-to-run projects and short video tutorials to move from installation to real traces quickly.
No. Traxcope is designed to observe software behavior while the firmware continues to run, helping preserve the timing and context you are investigating.
Traxcope currently targets ARM-based microcontrollers and supports bare-metal and FreeRTOS-based applications. The desktop application is available for Windows and Linux. Broader target and RTOS support is on the roadmap.
Yes. Community is permanent, allows commercial use and requires no account or licence key. It includes core views with one connected probe and three minutes of live streaming per hour.
Traxcope continues in Community mode. You can keep using the free features and request a Standard or Professional licence when you need unlimited streaming, recording or advanced workflows.
Yes. Solo Offline, Floating Team and Enterprise or Air-Gapped licence options are available on request.
Start with your own firmware
Download Traxcope, make your first connection and explore every Professional feature for 14 days.